Analytics

Can You Really Artificially Pump Account Quality Score?

4 Comments Written on October 12th, 2010 by
Categories: Analytics, Google Adwords, Keyword Research

I’ve been debating about whether to post on this or not, as it’s pretty much giving attention to quackery, but what the heck:

There’s a persistent ‘grey technique’ that’s been mentioned offline a number of times that centers around the theory that you can artificially pump your account-level quality scores in Adwords by paying a ‘QS-tax’: bidding on and directing traffic straight through to the top Adwords advertisers that have the lowest possible (read .01c) minimum CPCs on their brand terms.

The idea works like this:

-You create a new search campaign in Adwords that has one or two keywords and one adgroup only.

-Next, bid on [expedia] or [expedia.com] in your only adgroup in that campaign. (Or any of the top Adwords spenders for that matter)

-Write an ad that exactly matches the one the already uses brand uses for it’s own search term, i.e:

expedia adwords ad text

-In the destination URL, put the site’s usual URL (In this case, www.expedia.ca) and send the traffic directly to the brand.

-Set your campaign’s daily budget to like $50/day and let it rip.

Why On Earth Would You Do This?

Why would I buy ads for Expedia and send that traffic to them for free?  The theory is that doing this can raise your entire account’s Quality Scores.

How?

Well, obviously Expedia.ca is going to get a 10/10 for the term [expedia].  And of course there’s different minimum bids for a 10/10, but in this case, you’re looking at a .01 minimum bid.  Pretty well as low a bid as you’ll ever see on Adwords.  Your CTR on the exact match brand term with the exact ad that the brand uses is likely to be in my testing about 45% +.  That nice CTR is about as good as you’ll find on Adwords as well.

Proponents of this technique suggest that the account Quality Score lift that you get from paying this $50 daily fee or “Quality Score Tax” makes it more than worthwhile.

Does It Work?

Simply put: No.  While it’s true that above-average CTR and keyword Quality Scores across ALL of your campaigns can lead to a better account-level Quality Score, artificially simulating this type of performance in your account via this technique isn’t going to move the account Quality Score needle.  It’s just not.

Unless you only have one other campaign in your account to influence upward with this approach, one campaign with one adgroup, keyword and ad isn’t going to have a significant enough impact to move your entire account up the account Quality Score ladder.

Additionally, account-level Quality Score is only ONE of a number of Quality Scores that are in effect in your account. For instance, it’s particularly important to consider that many metrics in the auction are connected to your domain itself, not just your account. Save your $50/day and spend that on keywords that actually make you money, not Expedia:)

If anyone can conclusively prove that this technique definitively moves the needle in terms of raising account-wide Quality Scores, ping me and I’ll post your proof.

Evaluate Display Network Category Performance

1 Comment » Written on October 7th, 2010 by
Categories: Analytics, Conversion, Display Ads, Google Adwords

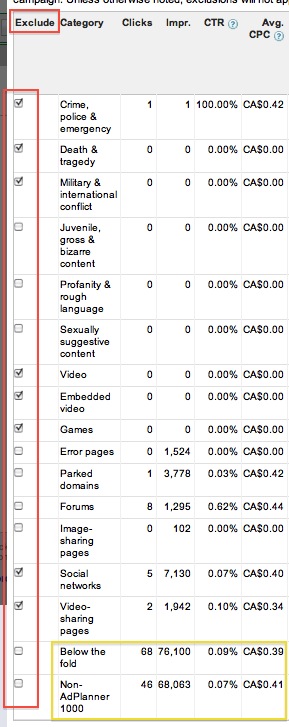
Many advertisers haven’t yet explored the performance breakdown Google provides on content network campaigns.  Most Adwords users know you can exclude sites that don’t convert based on data from your Display Network Placement Report, but Google has been slowly adding new data points to the site category exclusion options including the ability to view and/or prevent your content ads from showing on ad units below the fold, or outside of the Doubleclick Adplanner’s Top 1000 Sites list.

To view how you’re performing on different site categories, click the “Networks” tab in your content campaign (either at the campaign or the adgroup level) and scroll down to the bottom of the page to the link for “Exclusions”:

Adwords Site Category Exclusion

You’ll then see a full list of the types of sites you can view performance data on (depending on the date range you’ve selected):

Your cost-per-conversion data may signal that you need to exclude some site categories either at the campaign or adgroup level, or you might find that a particular site category performs exceptionally well for you, in which case you might want to look at placement targeting similar sites.

Either way you use the data, the option to get this kind of visibility into your content traffic is a welcome addition to Adwords platform:)

PS: Thank you so much to the PPCblog training and community members who participated in yesterday’s live Q&A call with myself, Rehan Zaidi, and Neil Patel!  The feedback has been great, and we’re going to make a live conference call a monthly feature for our members.

If you’re interested in becoming a member of our private community, you can find more details here!

How Adwords Counts Ad Impressions with Google Instant

20 Comments Written on September 8th, 2010 by
Categories: Analytics, Google Adwords

Today’s announcement from Google of their new seizure-inducing “Google Instant” search-as-you-type invention immediately made me stop and wonder (after rubbing my eyes from the headache of using it) how Adwords would count impressions on ads as they flash by in milliseconds.

Hat tip to David Szetela for tweeting out the update Google has just posted in their Adwords support section.

Basically, those fly-by impressions as your ad flickers across the screen aren’t going to destroy your CTR.  Looks like they (fortunately) gave this some thought ahead of time:

What changes

New predicted query

Although Google Instant won’t change the way ads are served, ads and search results will now be shown for a new “predicted query.” For example, if someone types “flow” into Google, an algorithm predicts that the user is searching for “flowers” (the predicted query) and therefore displays search listings and ads for flowers. Those results will continue to show unless the next letters that the user types lead to a different predicted query.

How impressions are counted

When someone searches using Google Instant, ad impressions are counted in these situations:

  • The user begins to type a query on Google and clicks anywhere on the page (a search result, an ad, a spell correction, a related search).
  • The user chooses a particular query by clicking the Search button, pressing Enter, or selecting one of the predicted queries.
  • The user stops typing, and the results are displayed for a minimum of three seconds.

We recommend monitoring your ads’ performance the same way you usually do. Google Instant might increase or decrease your overall impression levels. However, Google Instant can improve the quality of your clicks since it helps people search using terms that more directly connect them with the answers they need. Therefore, your overall campaign performance could improve.

So as usual, if they stick with this as a default option and too many people don’t opt out, they think they’ve got it covered but “monitor your campaigns’ performance just in case it screws up”.

Add Impression Share Data to Your Campaign Dashboard

4 Comments Written on August 25th, 2010 by
Categories: Analytics, Google Adwords, PPC Tools

As Google methodically picks off the reports in the Adwords Report Center, moving reporting to an ad-hoc model in the main campaign UI, some interesting little tricks are popping up.

In the past, if you tried to keep track of how much traffic Google is actually sending you compared to how much is truly available, you ran a campaign report and checked the box for “Impression Share”.

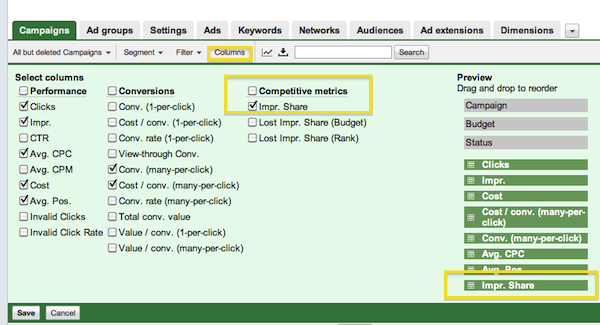
Now, that feature is gone from the Report Center, but with the new changes, you can tack it right to your campaign list columns:

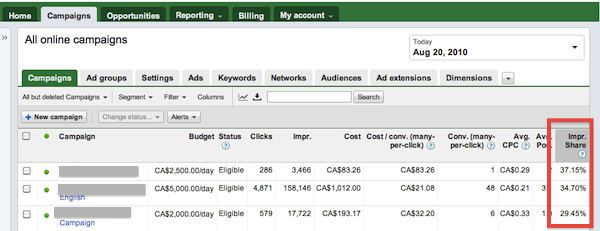
Now you’ll be able to view your Impression Share in real time right from the campaigns overview screen:

Pretty Handy!!

The Great Thing About Internal Search

4 Comments Written on August 11th, 2010 by
Categories: Analytics

Search marketing is typically associated with PPC and SEO. However, there’s an overlooked aspect of search that can provide some very powerful data – internal search.

Internal searches occur, obviously, when a person doesn’t find what they need on the page they land on.

You don’t often see internal search boxes displayed prominently on PPC landing pages, however if users do not find what they are looking for on your landing page, they are likely to click back.

However, if they make a further search on your site, you have another chance to get in front of them and collect data about their needs. You can then feed this information back into your PPC campaign by adding these search keywords to your ad groups and by creating new landing pages to target them.

Jakob Neilsen has undertaken research on in-site search usability.

He found that:

Search lets users control their own destiny and assert independence from websites’ attempt to direct how they use the Web. Testing situations routinely validate this. A typical comment is: “I don’t want to have to navigate this site the way they want me to. I just want to find the thing I’m looking for.” This is why many users go straight to the home page search function.

If the user doesn’t find what they are looking for on your landing page, then it makes sense to offer them a search option.

This also provides valuable insight about what might be “broken” on your site i.e. the areas where you aren’t giving users what they want. For example, if your top internal search query is “contact details” you may have inadvertently buried this information.

If your analytics package is comprehensive, you can link the PPC keyword they clicked-thru on to their internal search activity. This gives you a valuable insight into what may really be on their mind when they use a particular keyword. You can then re target your PPC campaign accordingly.

Try:

  • Placing a search box in a prominent place on your landing page – Neilsen recommends top right hand corner, but also consider placing a search box at the end of your copy, or near your desired action.
  • Track keyword terms in your analytics – once you have a list of keyword terms over, say, a week, you should start seeing patterns. These patterns might point to content that you aren’t providing, lack of clarity in your web design, or poorly targeted keyword terms i.e. the user searches on a keyword, but their intent is unclear
  • Make sure site search is accurate – Neilsen also noted that poor site search is next to useless. Check out Google’s Custom Search offering. There are various alternatives, of course.
  • Use site overlays – Some analytics packages offer site overlays that tell you where on the page users click the most. If you’ve got your ducks lined up, users really shouldn’t be using the search box in great numbers. If you’re getting a lot of clicks on the search box, it’s time to tweak your landing page content and structure.
  • Examine the exit rate on your search results page – if it is high, it indicates people still aren’t finding what they need in your search results. Consider adding appropriate content to your site and reviewing the relevancy of your search results

Internal search can provide some great data. It’s especially useful if your landing pages are getting a lot of click-backs, and you’re not sure why.

Give the user an opportunity to tell you.

The Business Of Web Analytics

2 Comments Written on July 22nd, 2010 by
Categories: Analytics
Tags:

The great thing about web analytics packages is that they are very powerful tools.

The downside of web analytics packages is that they are very powerful tools!

The sheer amount of data, and the complexity of reporting tools, such as Google Analytics, confuse many marketers. What can be overwhelming for the beginner can be just as overwhelming for the expert.

The trick lies in knowing which data is important. We can determine the importance of data by linking it back to clear business objectives.

Use Data To Drive Business Decisions

Google’s Marissa Meyer, places a lot of importance on metrics. So much so, some graphic designers have left Google, frustrated by what they perceive as Google’s “data-centerism”.

Google’s approach is to measure user interaction, and then use that data to make interface design decisions. They don’t assume they know the answer until the numbers are in. “Did more people get where they needed to go when Google uses a yellow graphic instead of a red one?”

If so, yellow wins.

Google approach design this way partly because they are maths geeks but also because Google made a business decision to put the user and user activity central to to their companies mission. Google reason that what is good for the user is also good for Google.

There are two core aspects to this approach when it comes to analytics:

Analytics should be customer behavior centric – i.e. did people get where they needed to be? Did they buy? What problems are they experiencing?

Analytics should solve business questions – i.e. how can we improve revenue by 15%? What is the most influential content on our website?

The Problem Of Data Overload

We’ll leave learning the detailed mechanics of using analytics packages to our PPC forums, and instead focus on the question all marketers must ask:

How are we really doing?

It can be fun to plot historical numbers against each other.

“Wow! We’ve received 1000 more visitors for our PPC campaign than last week!”. Analytics tools certainly encourage us to count numbers and present these numbers on pretty charts. It certainly looks impressive.

But what this data really mean, in a business sense?

Without clearly defining business goals linked to measurement, not a great deal.

For example, we may have received 1000 more visitors than last week, but our cost of customer acquisition went through the roof. Why did that happen? Was that event linked to the increase in traffic, or was there some other reason?

Clear business goals, in the form of questions, help us know which data points to focus on.

Ask a series of questions related to your business. “What is the cost of cost acquisition? What content drives the most sales?” Pick out the data that answers these questions, and or setup tracking that will achieve this end.

The data we use, and the tracking we set, will be different, of course, depending on our individual business needs. However, by starting with a list of clear questions, we stand a good chance of knowing which data is most important. It can also help focus what we do, and our organizations, around data analysis.

Web Analytics: An Hour A Day

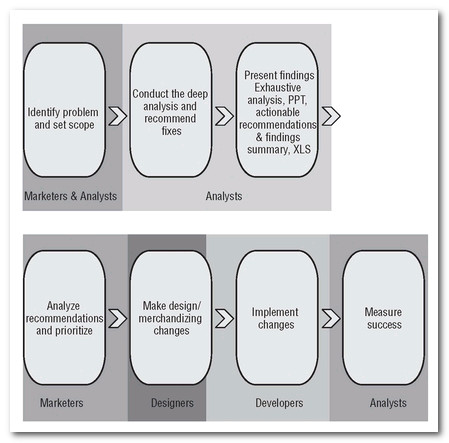
In Web Analytics: An Hour A Day, Avinash Kaushik outlines a seven step method for creating a data driven culture in your organization.

1. Go to the bottom line first – the clickstream is fun, but what you really want to know is teh answer to business questions, such as revenue, profits, profit margins, product mix etc.

2. Do analysis, not reporting – pretty charts are fun, but what do they really mean in terms of your business?

3. Depersonalize decision making – Take a leaf from Google’s book. Get rid of the politics of personality. It doesn’t matter who came up with the idea, the data should drive decision making.

4. Be Proactive, rather than reactive: If we think we need to make action X, what will the data look like that would support such a decision? Learn to recognize emerging patterns.

5. Empower everyone – everyone should be a data analyst. If a designer wants to know wether she should use this form or that, she should be looking to the analytics data for guidence.

6. Focus on three critical elements: experience, behaviour and outcomes. How much (outcomes), what is (behaviour), and why (experience)

7. Apply process: Adopting an analytics process helps you become data driven. Process is repeatable and ensures everyone is on the same page.

I recommend Avinash’s great book on Google Analytics. Also check out his website, Occams Razor.