The great thing about web analytics packages is that they are very powerful tools.
The downside of web analytics packages is that they are very powerful tools!
The sheer amount of data, and the complexity of reporting tools, such as Google Analytics, confuse many marketers. What can be overwhelming for the beginner can be just as overwhelming for the expert.
The trick lies in knowing which data is important. We can determine the importance of data by linking it back to clear business objectives.
Use Data To Drive Business Decisions

Google’s Marissa Meyer, places a lot of importance on metrics. So much so, some graphic designers have left Google, frustrated by what they perceive as Google’s “data-centerism”.
Google’s approach is to measure user interaction, and then use that data to make interface design decisions. They don’t assume they know the answer until the numbers are in. “Did more people get where they needed to go when Google uses a yellow graphic instead of a red one?”
If so, yellow wins.
Google approach design this way partly because they are maths geeks but also because Google made a business decision to put the user and user activity central to to their companies mission. Google reason that what is good for the user is also good for Google.
There are two core aspects to this approach when it comes to analytics:
Analytics should be customer behavior centric – i.e. did people get where they needed to be? Did they buy? What problems are they experiencing?
Analytics should solve business questions – i.e. how can we improve revenue by 15%? What is the most influential content on our website?
The Problem Of Data Overload
We’ll leave learning the detailed mechanics of using analytics packages to our PPC forums, and instead focus on the question all marketers must ask:
How are we really doing?
It can be fun to plot historical numbers against each other.
“Wow! We’ve received 1000 more visitors for our PPC campaign than last week!”. Analytics tools certainly encourage us to count numbers and present these numbers on pretty charts. It certainly looks impressive.
But what this data really mean, in a business sense?
Without clearly defining business goals linked to measurement, not a great deal.
For example, we may have received 1000 more visitors than last week, but our cost of customer acquisition went through the roof. Why did that happen? Was that event linked to the increase in traffic, or was there some other reason?
Clear business goals, in the form of questions, help us know which data points to focus on.
Ask a series of questions related to your business. “What is the cost of cost acquisition? What content drives the most sales?” Pick out the data that answers these questions, and or setup tracking that will achieve this end.
The data we use, and the tracking we set, will be different, of course, depending on our individual business needs. However, by starting with a list of clear questions, we stand a good chance of knowing which data is most important. It can also help focus what we do, and our organizations, around data analysis.
Web Analytics: An Hour A Day

In Web Analytics: An Hour A Day, Avinash Kaushik outlines a seven step method for creating a data driven culture in your organization.
1. Go to the bottom line first – the clickstream is fun, but what you really want to know is teh answer to business questions, such as revenue, profits, profit margins, product mix etc.
2. Do analysis, not reporting – pretty charts are fun, but what do they really mean in terms of your business?
3. Depersonalize decision making – Take a leaf from Google’s book. Get rid of the politics of personality. It doesn’t matter who came up with the idea, the data should drive decision making.
4. Be Proactive, rather than reactive: If we think we need to make action X, what will the data look like that would support such a decision? Learn to recognize emerging patterns.
5. Empower everyone – everyone should be a data analyst. If a designer wants to know wether she should use this form or that, she should be looking to the analytics data for guidence.
6. Focus on three critical elements: experience, behaviour and outcomes. How much (outcomes), what is (behaviour), and why (experience)
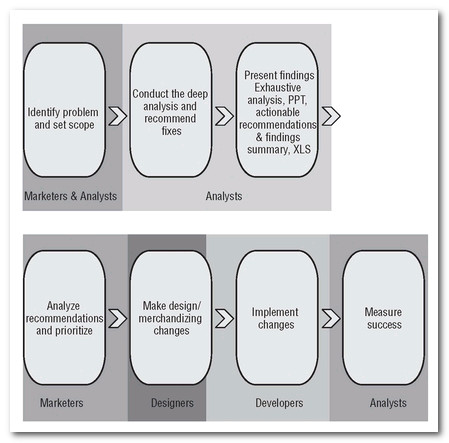
7. Apply process: Adopting an analytics process helps you become data driven. Process is repeatable and ensures everyone is on the same page.
I recommend Avinash’s great book on Google Analytics. Also check out his website, Occams Razor.


